Beneficial Electrification and Grid Opportunities
A Digital Report of the Active Efficiency Collaborative.
Beneficial electrification – transitioning end-uses powered by fossil fuels to electricity in circumstances where certain benefits are achieved – is a major trend that is accelerating in energy markets across the world.
Regional Insights
Beneficial electrification requires consideration of local context, including the local climate, the ease of electrifying certain end-uses, the electricity market structure and state-specific regulations, the conventional fuels in use, and state and local policies regarding decarbonization and fuel-switching.
Browse a few different geographical views of beneficial electrification at the state level, including:
- Figure 1: Heating fuels in the United States
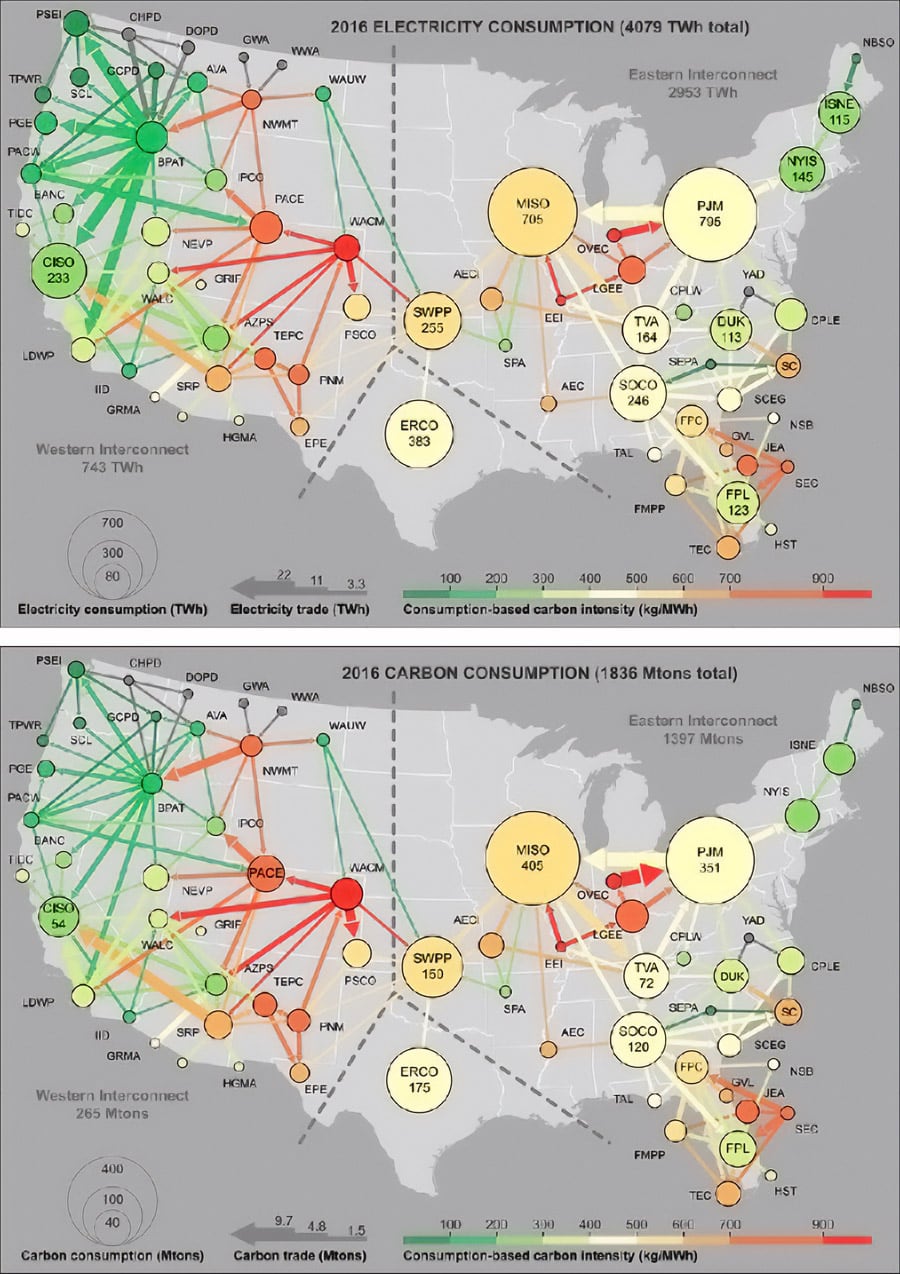
- Figure 2: Electricity consumption and carbon consumption across the U.S. power system; and
- A dynamic map, which allows comparisons of other datasets, including heating/cooling days, average electricity retail pricing, EV deployments, and policies related to GHG emissions reductions and electrification.
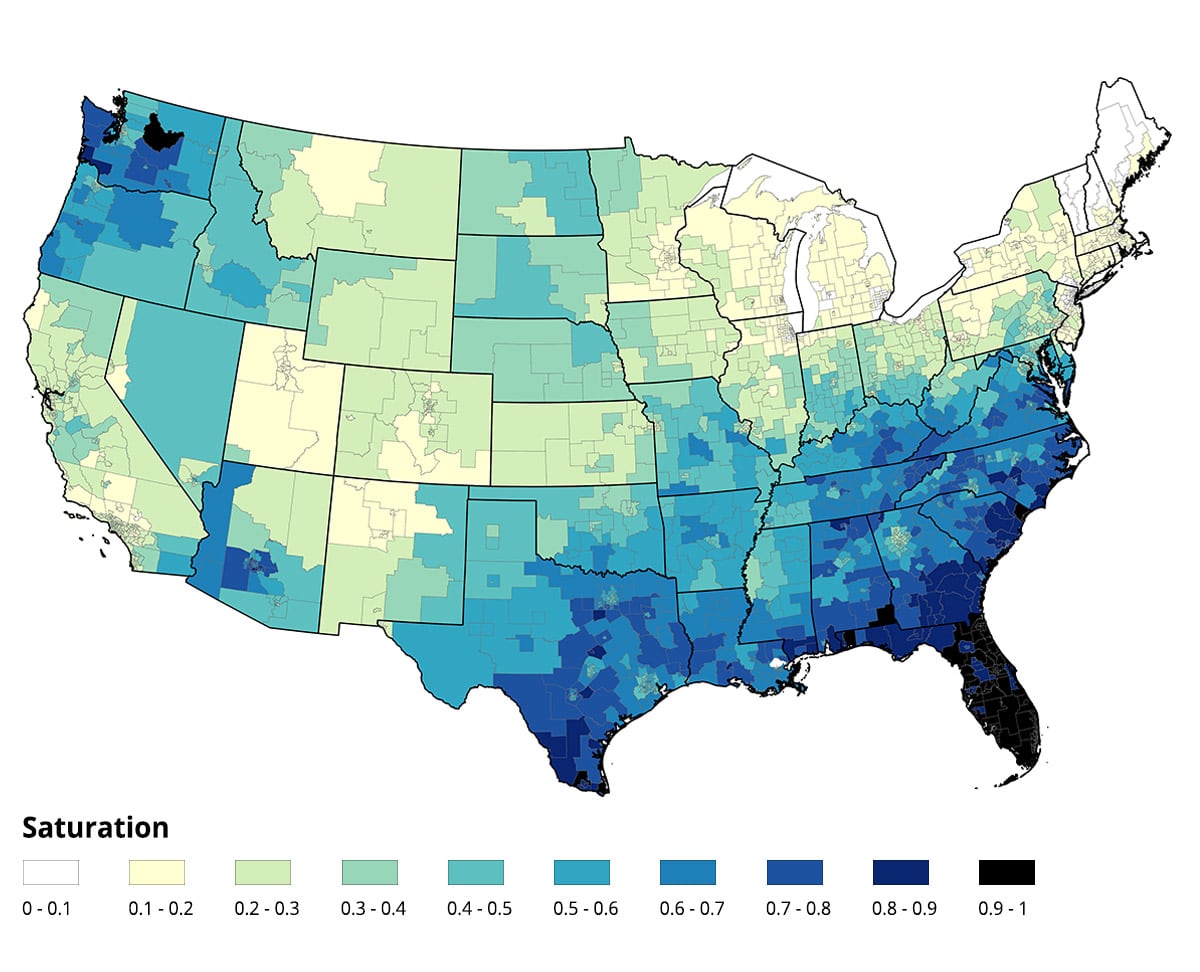
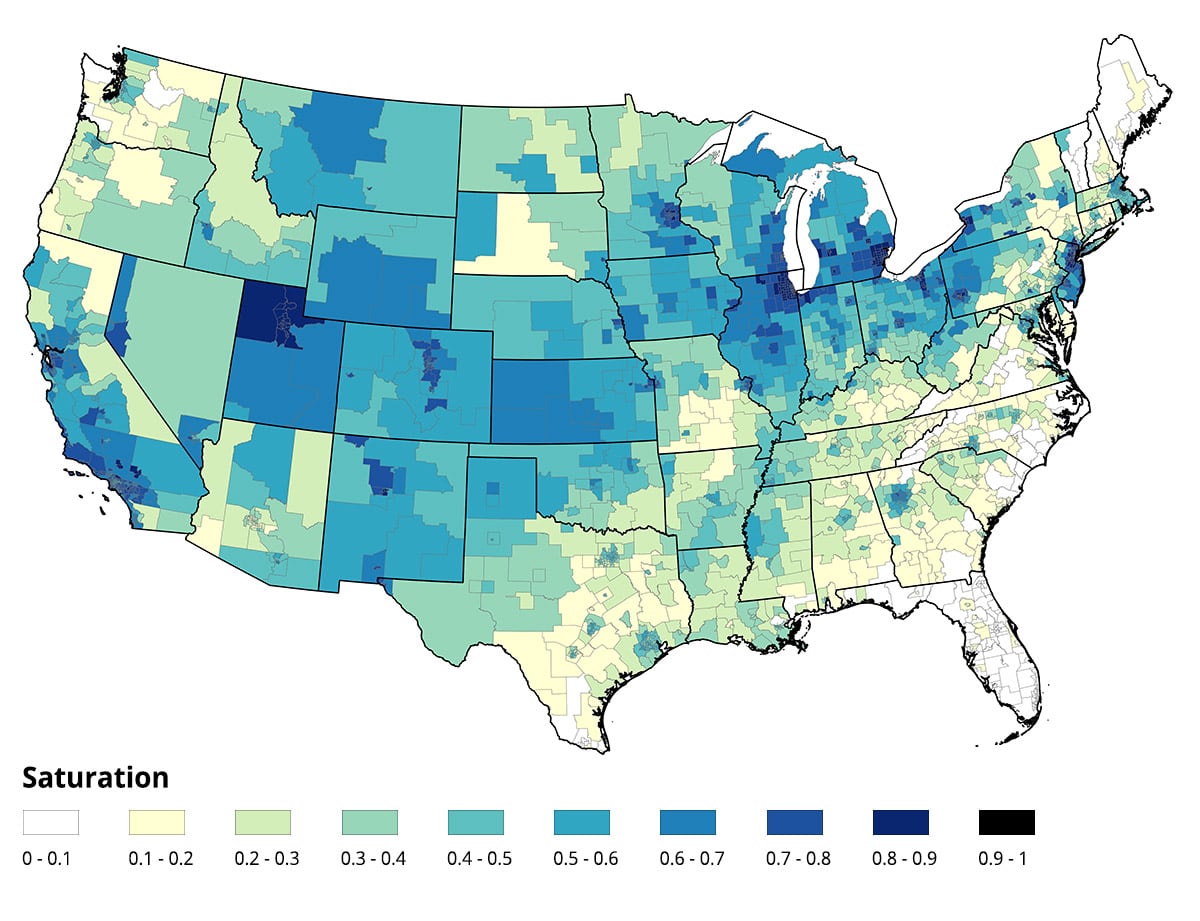
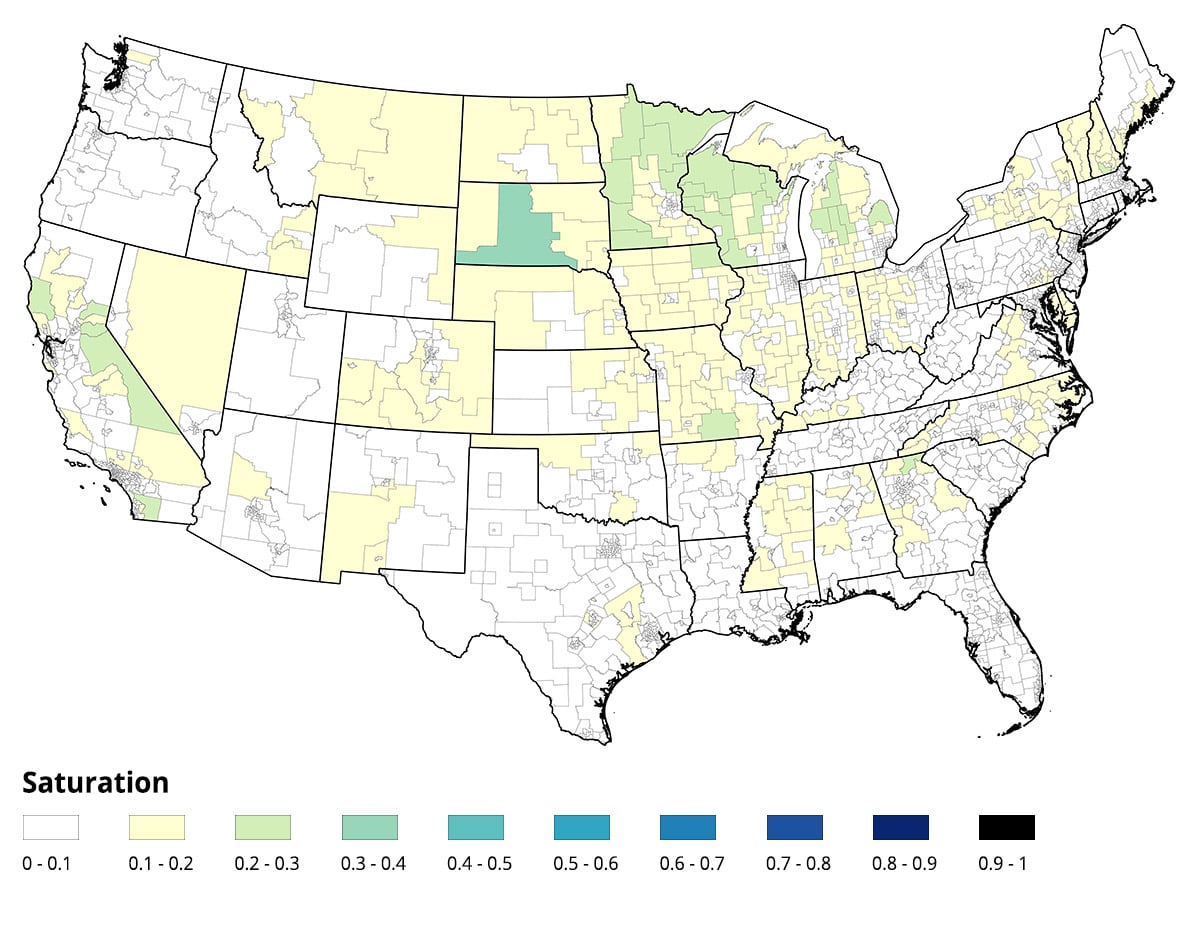
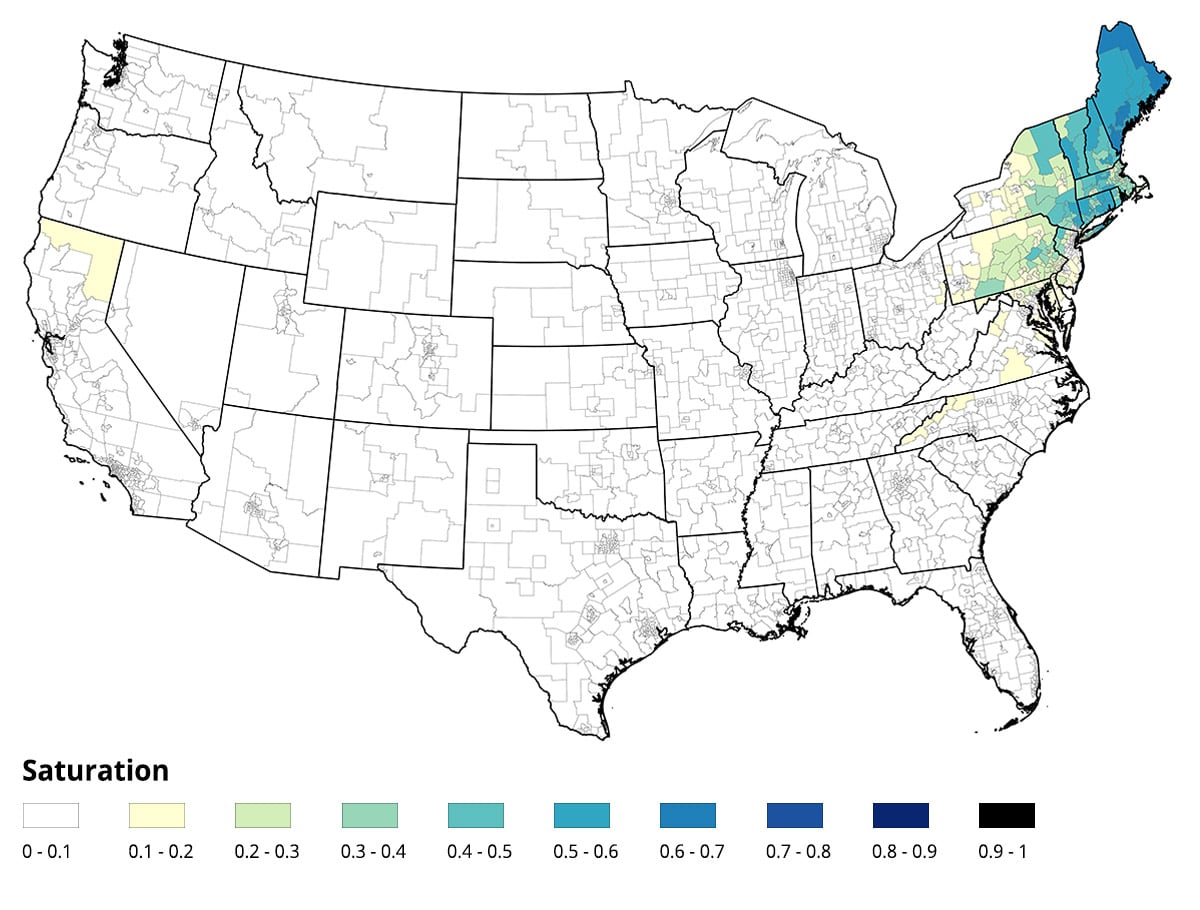
Figure 1: Fraction of housing units using a given fuel for primary space heating
Different regions of the United States rely on different heating fuels. Electricity is most common in the Southeast and Northwest; fuel oil is most common in the Northeast; natural gas is most common in cities, whereas propane and electricity (and fuel oil in the Northeast) are most common in rural areas where gas distribution is less common. This distribution suggests greater opportunities for beneficial electrification of heating functions in the Northeast, and potentially Midwest regions. Maps created by NREL using data from 5-yr 2017 Public Use Microdata Samples (PUMS). IPUMS USA, University of Minnesota, www.ipums.org.
Electricity
Natural Gas
Propane
Fuel Oil
Other Fuel
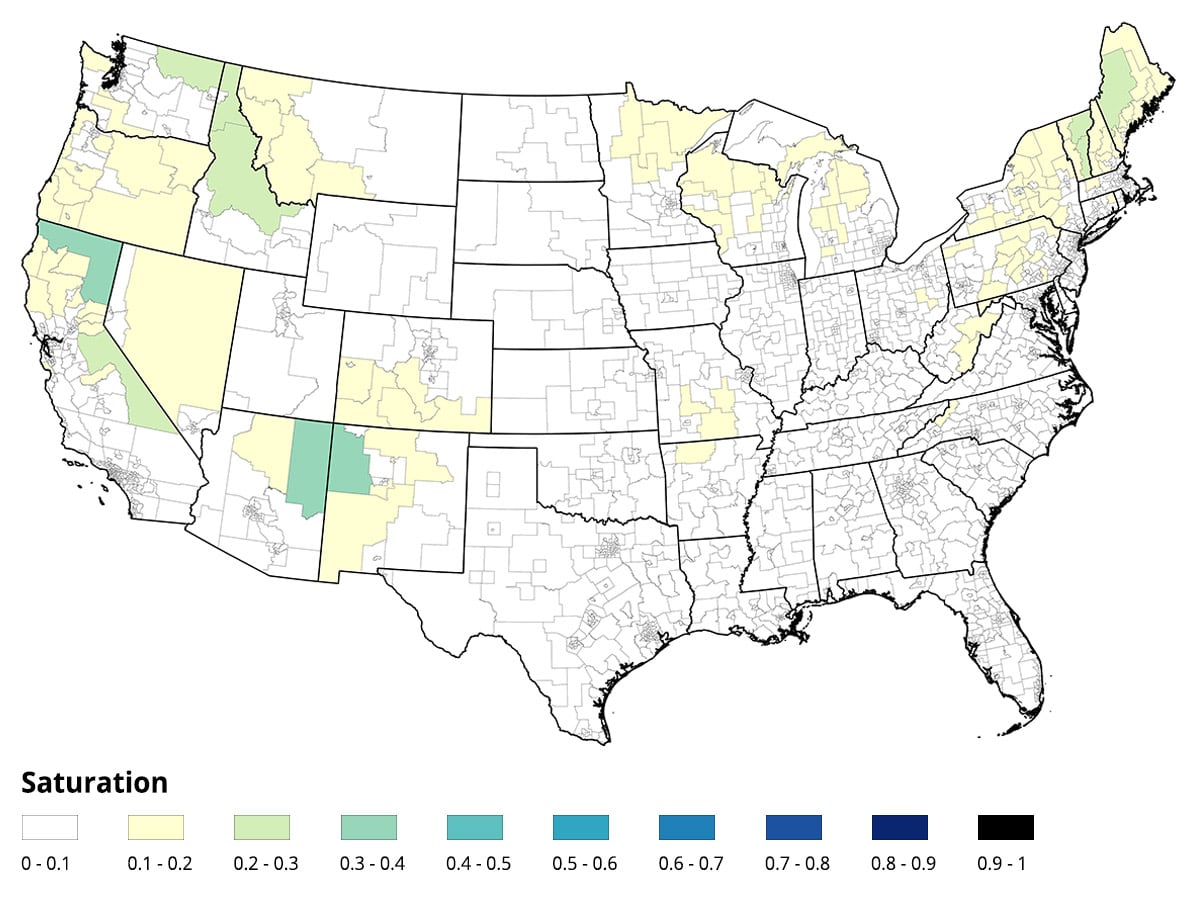
Figure 2: Electricity consumption and carbon consumption across the U.S. power system, 2016.
This map shows two views of the carbon footprint of the U.S. electricity system in 2016: electricity consumption (upper) and carbon consumption (lower), including the exchanges between balancing authorities. In general, the carbon intensity of electricity is the lowest in the Pacific Northwest, the Northeast, and California; it is the highest in the Rocky Mountains. (National Academy of Sciences, 2019)
Dynamic Regional Insights Map
Executive Target
Statutory Target
No target
Both Targets
Supportive policies in place, with additional specific guidance/rules pending
Fuel switching or substitution encouraged through guidelines or fuel-neutral goals
No policy but utilities or program administrators have received approval for fuel switching or substitution programs in certain cases
No fuel-switching or substitution policy or programs
Fuel switching or substitution prohibited or discouraged
Retail Electricity, Geotherm, and solar, divided by total energy use.
Retail Electricity, Geotherm, and solar, divided by total energy use.
Natural Gas
Retail Electricity
Petroleum
Other
Bar numerical values: 2018 energy consumption by fuel in Trillion BTU. Other category includes all other resources including coal, solar, biomass, and geothermal.
Regional Data Table
Explore the data that was used in the map above in a filterable table format for quick comparisons| State | Cost of Electricity (Cents/kWh) |
Electric Vehicles 2018 |
Degree Days Heating |
Degree Days Cooling |
Emissions Targets | Beneficial Electrification Policies |
Natural Gas | Petroleum | Electricity | Other | Natural Gas | Petroleum | Electricity | Other |
|---|---|---|---|---|---|---|---|---|---|---|---|---|---|---|
Alabama |
10.48 |
1450 |
3180 |
1879 |
No target |
No policy but utilities/program administrators have received approval in certain cases |
27.4 |
12.8 |
80.1 |
0.4 |
35.7 |
5.8 |
112.9 |
2.2 |
Alaska |
20.82 |
530 |
3534 |
846 |
No target |
Fuel switching or substitution encouraged through guidelines or fuel-neutral goals |
14.1 |
8.7 |
9 |
1.4 |
18.1 |
6.9 |
6.7 |
6 |
Arizona |
11.51 |
15000 |
5308 |
1397 |
No target |
Fuel switching or substitution prohibited or discouraged |
33.1 |
16.2 |
101.3 |
7.5 |
36.5 |
5 |
118.3 |
21.5 |
Arkansas |
8.88 |
520 |
2152 |
2750 |
No target |
Fuel switching or substitution prohibited or discouraged |
56.2 |
7.3 |
41.9 |
1.2 |
35.5 |
4 |
65.7 |
7.8 |
California |
19.26 |
256800 |
3534 |
846 |
Both |
Fuel switching or substitution encouraged through guidelines or fuel-neutral goals |
256.3 |
85.8 |
395.1 |
44.1 |
438.2 |
24.8 |
304 |
112.1 |
Colorado |
10.82 |
11700 |
5308 |
1397 |
Statutory Target |
Supportive policies in place, with additional specific guidance/rules pending |
59.9 |
14.2 |
71.7 |
4 |
137.6 |
11.8 |
65.8 |
15.1 |
Connecticut |
19.32 |
4450 |
6531 |
536 |
Statutory Target |
Supportive policies in place, with additional specific guidance/rules pending |
59.9 |
16.3 |
42.2 |
2.7 |
54.7 |
63.6 |
44.6 |
9.7 |
Delaware |
9.96 |
720 |
2383 |
2516 |
Executive Target |
No policy but utilities/program administrators have received approval in certain cases |
16.3 |
3.5 |
14.8 |
0.4 |
12.6 |
5.4 |
17.3 |
1.7 |
Florida |
10.53 |
25200 |
2383 |
2516 |
No target |
No fuel-switching or substitution policy or programs |
65.6 |
51.2 |
328.5 |
3.7 |
17.6 |
6.8 |
428.3 |
38.8 |
Georgia |
10.53 |
15300 |
2383 |
2516 |
No target |
No policy but utilities/program administrators have received approval in certain cases |
58.1 |
24.7 |
161.4 |
0.8 |
136.7 |
8.9 |
203.7 |
4.1 |
Hawaii |
26.09 |
6590 |
3534 |
846 |
Executive Target |
No fuel-switching or substitution policy or programs |
2.5 |
5.8 |
10.3 |
7.5 |
0.6 |
0.5 |
9.2 |
7.7 |
Idaho |
8.53 |
1080 |
5308 |
1397 |
No target |
No fuel-switching or substitution policy or programs |
19.9 |
5.5 |
22 |
2.8 |
28.6 |
4.4 |
28.8 |
14.4 |
Illinois |
9.46 |
12400 |
6428 |
832 |
No target |
No policy but utilities/program administrators have received approval in certain cases |
249.1 |
22.5 |
173.2 |
1.5 |
451 |
22.8 |
161.1 |
9.4 |
Indiana |
9.92 |
3030 |
6428 |
832 |
No target |
No fuel-switching or substitution policy or programs |
90.1 |
15.1 |
82.9 |
7 |
150.8 |
14.8 |
118 |
17.2 |
Iowa |
11.3 |
1090 |
7073 |
954 |
No target |
No fuel-switching or substitution policy or programs |
60.2 |
12.7 |
42.4 |
3.5 |
75.1 |
23.6 |
50.6 |
6 |
Kansas |
10.74 |
1610 |
7073 |
954 |
No target |
Fuel switching or substitution prohibited or discouraged |
41.8 |
6 |
55.2 |
1.4 |
69.7 |
8.4 |
48.4 |
4.6 |
Kentucky |
8.65 |
1240 |
3180 |
1879 |
No target |
No fuel-switching or substitution policy or programs |
40.4 |
10.2 |
68.2 |
2.5 |
54.1 |
6.4 |
94.6 |
11.3 |
Louisiana |
7.63 |
1110 |
2152 |
2750 |
No target |
Fuel switching or substitution prohibited or discouraged |
35.6 |
8.6 |
84.2 |
1.1 |
38.6 |
1.8 |
109.4 |
3.5 |
Maine |
13.53 |
750 |
6531 |
536 |
Both |
Supportive policies in place, with additional specific guidance/rules pending |
9.9 |
17.7 |
15.2 |
4.8 |
3.2 |
41 |
16.6 |
20.9 |
Maryland |
10.72 |
8080 |
2383 |
2516 |
Statutory Target |
No fuel-switching or substitution policy or programs |
80.7 |
19 |
100.8 |
4.2 |
90.2 |
21.8 |
96 |
11.8 |
Massachusetts |
18.33 |
9760 |
6531 |
536 |
Both |
Fuel switching or substitution encouraged through guidelines or fuel-neutral goals |
122.4 |
19.9 |
88.5 |
14.8 |
134.3 |
85.5 |
69.2 |
15.2 |
Michigan |
12.84 |
4210 |
6428 |
832 |
Executive Target |
No policy but utilities/program administrators have received approval in certain cases |
188.9 |
21.2 |
132.8 |
11.8 |
342.5 |
45.5 |
119.9 |
40.9 |
Minnesota |
11.59 |
4740 |
7073 |
954 |
Statutory Target |
Fuel switching or substitution prohibited or discouraged |
116.9 |
16.3 |
79.8 |
7.1 |
147.9 |
32.1 |
77.9 |
20.3 |
Mississippi |
9.18 |
390 |
3180 |
1879 |
No target |
No fuel-switching or substitution policy or programs |
21.6 |
7.7 |
49.6 |
1 |
25.1 |
5.5 |
65.9 |
1.7 |
Missouri |
11 |
3450 |
7073 |
954 |
No target |
No fuel-switching or substitution policy or programs |
70.7 |
16.5 |
106.4 |
5.3 |
116.2 |
16.7 |
127.8 |
21 |
Montana |
9.33 |
500 |
5308 |
1397 |
Executive Target |
No fuel-switching or substitution policy or programs |
27.4 |
3.6 |
16.8 |
2.4 |
23.6 |
7.2 |
17.7 |
14.4 |
Nebraska |
9.88 |
850 |
7073 |
954 |
No target |
No fuel-switching or substitution policy or programs |
37.5 |
5 |
32.6 |
1.3 |
44.9 |
6.6 |
35.5 |
3.4 |
Nevada |
8.88 |
4810 |
5308 |
1397 |
Statutory Target |
No fuel-switching or substitution policy or programs |
34 |
8.6 |
41.4 |
3.1 |
43.4 |
2.1 |
45.9 |
7.3 |
New Hampshire |
16.01 |
1120 |
6531 |
536 |
Executive Target |
No policy but utilities/program administrators have received approval in certain cases |
10.4 |
13.3 |
15.2 |
2.8 |
8.4 |
36.7 |
15.8 |
13.2 |
New Jersey |
14.73 |
12100 |
5754 |
784 |
Executive Target |
Supportive policies in place, with additional specific guidance/rules pending |
174.1 |
20.7 |
132.4 |
13.1 |
257.5 |
29.7 |
100.8 |
12.7 |
New Mexico |
10.53 |
1260 |
5308 |
1397 |
Executive Target |
No fuel-switching or substitution policy or programs |
26.9 |
4.3 |
30.8 |
2.5 |
35.6 |
4.4 |
23.3 |
12.7 |
New York |
16.03 |
16600 |
5754 |
784 |
Statutory Target |
Fuel switching or substitution encouraged through guidelines or fuel-neutral goals |
341 |
71.6 |
261.9 |
16.6 |
501.6 |
137.1 |
177.9 |
44 |
North Carolina |
9.66 |
7320 |
2383 |
2516 |
Executive Target |
No fuel-switching or substitution policy or programs |
59.7 |
27.3 |
168.2 |
4.2 |
75.4 |
23.8 |
210.3 |
12.1 |
North Dakota |
9.33 |
170 |
7073 |
954 |
No target |
No fuel-switching or substitution policy or programs |
15.6 |
3.7 |
23.3 |
0.5 |
13.7 |
7.1 |
17.5 |
1.1 |
Ohio |
9.51 |
6510 |
6428 |
832 |
No target |
No fuel-switching or substitution policy or programs |
190.8 |
32.5 |
161 |
5.3 |
321.3 |
27.8 |
185.8 |
24.5 |
Oklahoma |
8.04 |
3290 |
2152 |
2750 |
No target |
Fuel switching or substitution prohibited or discouraged |
48.5 |
9.9 |
72.4 |
0.6 |
69.5 |
7.9 |
82.3 |
4.2 |
Oregon |
9.2 |
12400 |
3534 |
846 |
Both |
No fuel-switching or substitution policy or programs |
31 |
11.3 |
56.2 |
5.5 |
45.5 |
4.5 |
64.6 |
26.5 |
Pennsylvania |
9.79 |
7990 |
5754 |
784 |
Executive Target |
Fuel switching or substitution prohibited or discouraged |
171.6 |
43.5 |
147.5 |
9.7 |
262.7 |
107.8 |
190.7 |
38.7 |
Rhode Island |
17.45 |
600 |
6531 |
536 |
Statutory Target |
No policy but utilities/program administrators have received approval in certain cases |
13.1 |
4 |
12.6 |
0.7 |
21.1 |
16.3 |
10.7 |
1.7 |
South Carolina |
10.1 |
1950 |
2383 |
2516 |
No target |
Fuel switching or substitution prohibited or discouraged |
26 |
12.8 |
75.9 |
0.9 |
31.5 |
5.1 |
108.7 |
3.8 |
South Dakota |
10.43 |
260 |
7073 |
954 |
No target |
No fuel-switching or substitution policy or programs |
13.4 |
2.3 |
16.7 |
1.4 |
15.2 |
5.4 |
17.1 |
3.1 |
Tennessee |
9.81 |
3980 |
3180 |
1879 |
No target |
Fuel switching or substitution encouraged through guidelines or fuel-neutral goals |
61 |
14.8 |
126 |
1.7 |
77.6 |
7 |
151.4 |
7.6 |
Texas |
8.82 |
22600 |
2152 |
2750 |
No target |
Fuel switching or substitution prohibited or discouraged |
220.2 |
46.7 |
489.7 |
3.4 |
233.4 |
16.7 |
536.6 |
9.6 |
Utah |
9.01 |
5220 |
5308 |
1397 |
No target |
No fuel-switching or substitution policy or programs |
44.2 |
6.2 |
41.2 |
1.9 |
70.3 |
2.7 |
33.1 |
7.1 |
Vermont |
16.2 |
1060 |
6531 |
536 |
Statutory Target |
Fuel switching or substitution encouraged through guidelines or fuel-neutral goals |
7.6 |
7.4 |
6.8 |
2.9 |
4.2 |
18 |
7.2 |
16.1 |
Virginia |
9.53 |
8370 |
2383 |
2516 |
No target |
No fuel-switching or substitution policy or programs |
78.6 |
29.7 |
178.3 |
7.9 |
94.2 |
23.8 |
163.6 |
15.5 |
Washington |
8.32 |
28400 |
3534 |
846 |
Statutory Target |
Fuel switching or substitution prohibited or discouraged |
62 |
21 |
100.3 |
5.3 |
90.8 |
12.2 |
120.6 |
29.2 |
West Virginia |
8.8 |
230 |
2383 |
2516 |
No target |
Fuel switching or substitution prohibited or discouraged |
27.4 |
5.2 |
26.5 |
1.5 |
28.7 |
4 |
39.9 |
9.7 |
Wisconsin |
11.72 |
3680 |
6428 |
832 |
No target |
No policy but utilities/program administrators have received approval in certain cases |
104.8 |
15.2 |
82.2 |
5.3 |
151.5 |
29.5 |
76.6 |
30.4 |
Wyoming |
8.51 |
170 |
5308 |
1397 |
No target |
No fuel-switching or substitution policy or programs |
14.7 |
2.4 |
12.8 |
1.1 |
14 |
3.4 |
9.4 |
4.3 |